Our Wise Forecast system provides two kinds of forecasts: (1) the path-wise forecast and (2) the turning points forecast. Investors can use them as references when they make investment and trading decisions.
The following example is the Mid-Term Forecast of the S&P 500 index generated on December 6th, 2018(the forecast date). It is an example of a “path-wise” forecast.
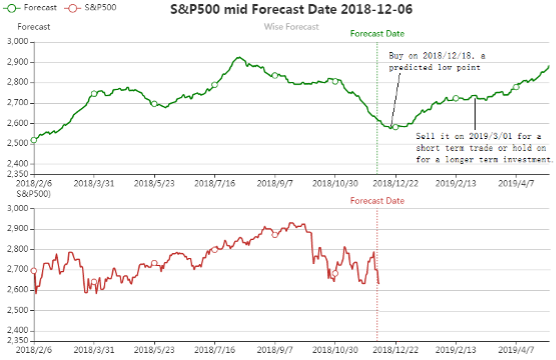
The chart consists of two regions: the left side “model tracking” region and the right side “forecast” region separated by the vertical dotted line at the “forecast date”. The red line in the lower chart shows the market price history of the S&P500. The upper green line is the forecast of the S&P500. In the model tracking region, the Wise Forecast system dynamically adapts itself to closely follow the movements of the market. In the forecast region, our system naturally evolves into the future to predict the most likely price trajectory.
Using this forecast as a reference, one may decide to buy the S&P500 on 2018/12/18 ( which is the predicted lowest point of the price path) with the plan to sell it in January 2019 as the forecasted price line levels off or hold on to it as the price may continue to rise.
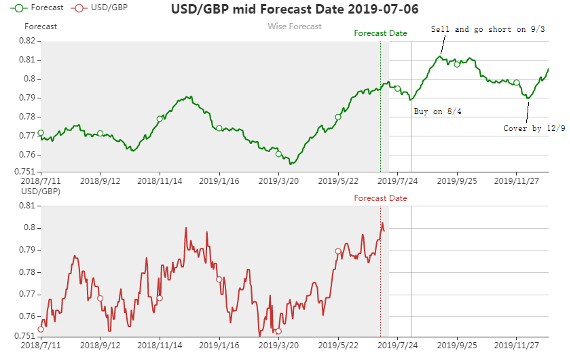
The next example is the forecast of USD/GBP foreign exchange rates generated on July 6, 2019. One can use it as a reference to derive a trading strategy: buy it (buy USD and sell GBP) on August 4th, sell it and go short on September 3rd, and cover the short position by December 9th, 2019.
We intend that Wise Forecast only be used by experienced institutional investors. The forecasts may turn out incorrect or inaccurate, and one should stop loss promptly according to strict risk management rules.
The guidelines for using the path-wise forecasts are summarized as follows:
(1) Instead of making predictions of price levels, the Wise Forecast emphasizes trends and turning points.
(2) The Wise Forecast should be used mainly as a market timing tool.
(3) The start of a significant rising trend offers a buying opportunity; the beginning of a downward trend provides a selling (shorting) opportunity.
(4) Apply strict risk management rules to curb losses if the forecasts turn out wrong.
Now we go on to explain how one can use Turning Point Forecast as a reference when contemplating investment and trading strategies.
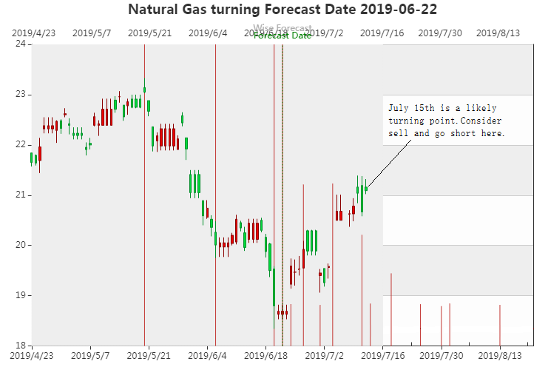
The above chart is the turning point forecast of Natural Gas generated on June 22nd, 2019. Similar to the path-wise forecast, the left side of the forecast date (indicated by the vertical dotted line) is the model tracking region in which our Wise Forecast system detects historical market turning points and marks them with a vertical (red) line. For example, one can see that May 19th and June 20th, 2019 are two major market turning points, while June 5th, 2019 is a minor turning point. The region to the left of the forecast date (June 22nd, 2019) is the forecast region in which our system draws a vertical line at each likely future market turning point; the height of the vertical line is drawn proportional to the likelihood of the forecast becoming true.
Suppose today is July 15th, 2019, looking at the forecast chart, what is the trading strategy? We can see that the market has moved up to a likely turning point region (both July 14th and 15th are forecasted turning points with high likelihood), the next move is likely a decline. Therefore we can sell the natural gas contracts and go short, with a plan to exit the trade on July 17th (the next forecasted turning point).
The general rules of using the turning points forecast are summarized as follows:
(1) We don’t know if a likely turning point is a peak or a trough beforehand.
(2) If the market declines to a turning point, then it is likely a trough – consider it a buying opportunity.
(3) If the market rises to a turning point, then it is likely a peak – consider it a selling (or shorting) opportunity.
(4) Apply strict risk management rules to curb losses if the forecast turns out wrong.
We want to remind our readers that both kinds of Wise Forecast emphasize the forecast of market trends and turning points rather than price levels. Users of Wise Forecast should pay more attention to the timings of their trades instead of focusing on entry and exit price targets.